Ecommerce analytics metrics glossary 2026: the 7 that matter
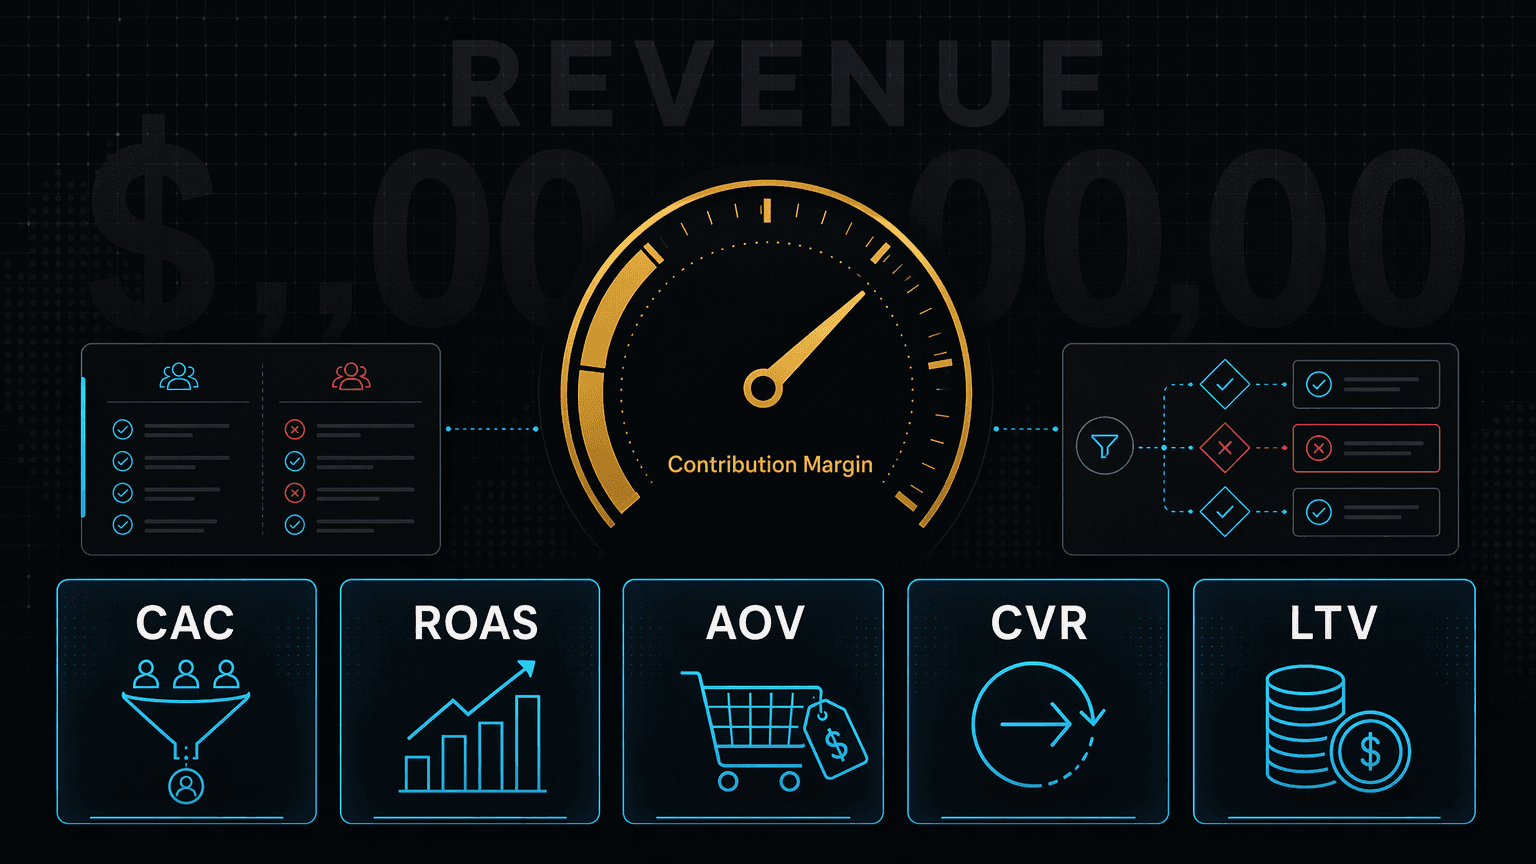
Ecommerce analytics metrics glossary: CAC, ROAS, AOV, CVR, LTV, contribution margin and refund rate, with exact formulas, worked numbers and healthy ranges.
Seven ecommerce metrics decide whether your store lives or dies. Revenue is not one of them. Here are the formulas, the worked numbers, and the healthy ranges.
By Maxime Yao, research editor | Published 2026-07-17
You did $40,000 last month. You told your friends. You screenshotted the Shopify dashboard. And then the card processor cleared, the supplier invoice landed, the ad account drained, and the returns rolled in, and your bank balance was smaller than the month you did $22,000. The number that felt like a win was the number that lied to you.
This is a glossary, but it is not neutral. It is built around one argument: the metric you brag about is almost never the metric that keeps you alive. Below are the seven ecommerce analytics metrics that actually decide survival, each with its exact formula, a worked number you can copy, a healthy range attributed to a real benchmark source, and the vanity metric it is meant to replace. One of them is the number the whole game settles on. We build to it.
- The lie: revenue is the metric that matters. It is the first number you see and the last one you should trust.
- The fix: seven metrics with formulas, CVR, AOV, CAC, ROAS and breakeven ROAS, LTV, refund and chargeback rate, and the one they all feed.
- The number: contribution margin. What is left from a sale after every variable cost, including the ad that won it. This is the survival metric.
- Healthy anchors: Shopify conversion around 1.4% median (Littledata), LTV:CAC of 3:1 (David Skok research), breakeven ROAS equals 1 divided by your margin, chargebacks under 0.65% (industry average).
- The tool angle: a bundle like Ecom Tools gives you the analytics inputs, KaloData for TikTok Shop revenue and AOV, ShopHunter for competitor sales, but the contribution-margin math is still yours to run.
The lie: revenue is the metric that matters

Revenue is the most seductive number in commerce because it is the biggest and the easiest to move. Drop your price, run a flash sale, buy cheap traffic, and revenue climbs. So does your heart rate. None of it tells you whether you made a single dollar.
Revenue is a top-line number. It sits at the very top of the profit-and-loss statement, before the cost of the product, before shipping, before the ad that dragged the customer in, before the 18% of orders that come back. Everything expensive happens below the line you are staring at. A store can grow revenue every month and go bankrupt the same year. It happens constantly, and it happens to operators who never once looked past the headline.
The trap is that revenue is a real number attached to a fake feeling. It is not that revenue is meaningless. It is that revenue answers a question nobody paying you actually asked. The question is not how much money moved. The question is how much money stayed. Those are different numbers, and the gap between them is where dropshipping businesses quietly die.
So kill the belief now: revenue is a scoreboard, not a diagnosis. The seven metrics below are the diagnosis.
The fix: the seven survival metrics, on one card
Read this table first as a map, then use the sections underneath as the detail. Every formula here is standard. Every range is attributed to a named source with the caveat that benchmarks are directional, not law, because methodologies differ and your vertical is not the average.
| Metric | Exact formula | Healthy range (source) | The vanity metric it kills |
|---|---|---|---|
| Conversion rate (CVR) | Orders / Sessions x 100 | ~1.4% Shopify median, 3.2%+ top 20% (Littledata); 2% to 3% broad ecommerce (Dynamic Yield) | Traffic and pageviews |
| Average order value (AOV) | Total revenue / Number of orders | ~$85.50 Shopify average; ~$150 global (Dynamic Yield); wildly vertical-dependent | Total order count |
| Customer acquisition cost (CAC) | Total sales and marketing spend / New customers acquired | No universal number; judge only against LTV (below) | Cost per click and impressions |
| ROAS and breakeven ROAS | Revenue from ads / Ad spend; breakeven = 1 / profit margin | Average ~2.87:1, median ~2.04:1; healthy 3:1 to 4:1 (industry benchmarks) | Raw ad revenue |
| Lifetime value (LTV) | AOV x purchase frequency x customer lifespan x gross margin | LTV:CAC of 3:1 healthy, 4:1 to 5:1 strong (David Skok research) | First-order revenue |
| Refund and chargeback rate | Refunds / Orders; chargebacks / transactions | Returns ~17% to 20% of online orders (NRF); chargebacks under 0.65% average, stay below 0.5% | Gross booked sales |
| Contribution margin | Revenue minus all variable costs (per order or as a percent) | Must clear your fixed costs and CAC; positive after marketing or you lose money at scale | Revenue itself |
Seven rows. The first six are inputs. The seventh is the verdict. Now the detail, each with a number you can steal.
Conversion rate (CVR): the traffic killer
Formula: CVR = (Orders divided by Sessions) x 100. If 4,000 sessions produce 60 orders, your conversion rate is 1.5%.
What it replaces: traffic. A store owner bragging about 100,000 visitors is bragging about a cost, not a result. Traffic is what you buy. Conversion is what you earn. Two stores with identical traffic and different conversion rates are two completely different businesses.
Healthy range: the most representative baseline for a typical Shopify store is around 1.4%, per Littledata's benchmark of roughly 2,800 Shopify sites, with 3.2% or higher putting you in the top 20% and 4.7% in the top 10%. Broader ecommerce averages sit around 2% to 3%, with Dynamic Yield reporting a global figure near 2.66%. But the spread is huge and honest sources warn against the blended number: mobile converts near 2.87% against 4.51% for desktop, and category matters enormously, with food and beverage converting several times higher than luxury. One benchmark found average order value predicts conversion better than industry does: stores under $60 converted near 4.6%, stores over $200 near 0.95%.
Use CVR to diagnose your funnel, not to compare yourself to a stranger's store. The right question, as Shopify's own guide puts it, is whether your rate is strong for your price point and improving over time.
Average order value (AOV): the order-count killer

Formula: AOV = Total revenue divided by number of orders. $30,000 across 400 orders is a $75 AOV.
What it replaces: order count. Chasing more orders is chasing more shipping labels, more support tickets, more payment fees, more chances for a return. Raising AOV raises revenue with none of that extra handling. As one benchmark put it, a 10% lift in AOV has the same revenue impact as a 10% lift in traffic, without spending a dollar on acquisition. That is why AOV is a lever and order count is a treadmill.
Healthy range: the average Shopify AOV is around $85.50, while broader global ecommerce sits near $150 in late 2025 per Dynamic Yield, the gap explained by high-ticket B2B and marketplace data inflating the global figure. By vertical the numbers scatter wildly: Eightx pegs fashion at roughly $80 to $200, beauty $55 to $137, supplements $45 to $120, home goods $95 to $295, electronics $120 to $348, and jewelry $180 to $436. The lesson is blunt: an apparel brand at $85 is healthy, a furniture brand at $85 is broken. Benchmark against your own category, and treat every figure as point-in-time, because AOV shifts quarterly with mix and pricing.
Customer acquisition cost (CAC): the click-cost killer
Formula: CAC = total sales and marketing spend divided by new customers acquired. Spend $10,000, acquire 100 customers, CAC is $100. Include everything: ad spend, agency fees, the software, the creative costs. A CAC that only counts media spend is a CAC that lies.
What it replaces: cost per click, cost per impression, and every other top-of-funnel proxy. A cheap click that never becomes a customer is not cheap. It is free money handed to the ad platform. CAC is the only acquisition cost that ends at a paying human.
Healthy range: there is no universal CAC benchmark, and anyone quoting one is guessing, because a $40 CAC is suicide on a $50 product and a bargain on a $400 one. CAC is meaningless alone. It only means something next to lifetime value, which is the next metric. Note too that CAC almost always rises as a channel saturates, so a business that only survives at today's CAC is a business on a timer.
ROAS and breakeven ROAS: the revenue-per-ad killer
Formula: ROAS = revenue from ads divided by ad spend. $40,000 from $10,000 is a 4:1 ROAS. The number that actually matters, though, is breakeven ROAS = 1 divided by your profit margin. At a 25% margin, breakeven ROAS is 1 divided by 0.25, which is 4.0. That means a 4:1 ROAS on a 25% margin product is not a win. It is breaking even. You worked for free.
What it replaces: raw ad revenue, and ROAS read in isolation. A 4x ROAS sounds great until you remember ROAS measures revenue, not profit. It ignores the cost of the product entirely. This is the exact same lie as the revenue lie, wearing an advertising costume.
Healthy range: across ecommerce the average ROAS is around 2.87:1, though the median is closer to 2.04:1, meaning half of all stores sit below that, per aggregated 2026 benchmarks. Most operators treat 3:1 to 4:1 as healthy. But the only ROAS target that matters is yours, and you get it from your margin. A 60% margin brand breaks even at 1.67x. A 20% margin electronics brand needs 5x just to survive. If repeat purchases are strong, you can accept a lower first-order ROAS because lifetime value covers the gap, which is the whole argument for the next metric. For the deeper question of what ad data can and cannot prove before you trust a ROAS at all, see what ad spy data really proves.
Lifetime value (LTV): the first-order killer
Formula: a standard ecommerce version is LTV = AOV x purchase frequency x customer lifespan x gross margin. A customer with a $75 AOV who buys 3 times a year for 2 years at a 40% gross margin is worth 75 x 3 x 2 x 0.40, which is $180 in gross profit. The critical rule, stated by every serious source: use gross margin, not revenue. A customer who spends $300 over their life at 50% COGS is worth $150 to you, not $300. Use revenue and you inflate the ratio and make bad economics look good.
What it replaces: first-order revenue. Judging a customer by their first purchase is like judging a book by its cover price. The money in ecommerce is in the second, third, and tenth order. LTV is what lets you decide how much you can afford to pay to acquire, which is why it is always read as a ratio against CAC.
Healthy range: the widely cited benchmark is an LTV:CAC ratio of 3:1, backed by David Skok's research across hundreds of companies, which found businesses below 3:1 consistently struggled to reach profitability. Read the ladder: 1:1 means you are losing money once you count shipping and tax, 2:1 is a thin cushion, 3:1 is healthy, and 4:1 to 5:1 is the target of the most profitable brands, per benchmarks from Daasity and others. Above 5:1 you may be under-investing in growth. Vertical matters: supplements and coffee run high on repeat purchases, apparel and home goods run lower. And beware the blended number, because a 4:1 average can hide one channel at 5:1 and another bleeding at 1.5:1.
Refund and chargeback rate: the gross-sales killer
Formula: refund rate = refunds divided by orders. Chargeback rate = chargebacks divided by transactions, expressed as a percent. They are different animals: a refund is a customer asking you, a chargeback is a customer going over your head to their bank.
What it replaces: gross booked sales. Every store that counts a sale the moment the card clears is counting money that has not finished arriving. Returns and chargebacks are the tide going back out, and they take profit with them at a punishing rate, because you lose the product, the shipping both ways, the payment fee, and sometimes a penalty on top.
Healthy range: returns run high and are normal, around 17% to 20% of online orders per the National Retail Federation's returns data, with apparel at a brutal 20% to 40% and electronics nearer 8% to 15%. Chargebacks are the dangerous one. The all-industry average sits near 0.65%, and the practical target is to stay under 0.5% as a buffer, because networks punish excess. This is the metric with a hard 2026 deadline attached: Visa's excessive-merchant threshold, reported at 2.2%, tightens to 1.5% on April 1, 2026, and processors flag merchants internally around 0.9%. Cross a line and you can lose your ability to take payments at all. Confirm the current thresholds with your processor, because network rules change and the figures above are as reported in 2026 benchmark write-ups, not a guarantee.
The number: contribution margin, the metric that decides survival
Here is the number the whole glossary was walking toward. Contribution margin is what a sale leaves behind after every variable cost, including the ad that won it. It is the opposite of revenue: revenue is what came in the door, contribution margin is what is still in your hand when the door closes.
Formula: Contribution margin per order = AOV minus all variable costs. The variable costs are the ones that only exist because the sale happened: cost of goods, shipping and fulfillment, payment processing fees, a returns allowance, and discounts. Subtract those and you get contribution margin. Subtract your CAC on top and you get contribution margin after marketing, which many DTC operators call CM3, and which is the truest survival number of all, because it is the money left to cover rent, salaries, software, and profit.
Worked number. Follow it once and you will never trust revenue again. This is illustrative math, based on typical figures; plug in your own.
| Line | Amount |
|---|---|
| Average order value (revenue) | $75.00 |
| Less cost of goods sold | -$22.00 |
| Less shipping and fulfillment | -$9.00 |
| Less payment processing fee | -$2.50 |
| Less returns allowance | -$4.00 |
| Contribution margin | $37.50 (50%) |
| Less customer acquisition cost | -$28.00 |
| Contribution margin after marketing | $9.50 |
Look at what happened. A $75 order. A healthy-looking 50% contribution margin. And after the ad cost that won the customer, $9.50 left to run the entire business. That $9.50 is the real number. It is what has to pay for everything revenue pretended was already handled. Now imagine CAC creeps from $28 to $38 as your channel saturates, which the benchmarks say it will. Contribution margin after marketing goes negative, and you are paying customers to buy from you, at scale, while your revenue chart climbs. That is the exact mechanism by which a growing store dies, and contribution margin is the only metric that sees it coming.
This is why contribution margin, not revenue, is the metric that matters. It is the number that connects every other metric on this page. AOV feeds the top of it. CVR determines how much traffic you needed. CAC and ROAS set the marketing line. Returns eat into it. LTV tells you how negative you can safely run it on the first order. Revenue tells you none of that. It just tells you a story.
Where a bundle and KaloData touch these metrics
You compute contribution margin from your own books: Shopify for revenue and orders, your supplier invoice for COGS, your processor for fees. No tool hands you that number, and any tool claiming to know your margin without your cost data is guessing. What tools do give you is the other half: the market inputs and competitor benchmarks that turn a raw metric into a decision.
This is where a group-buy bundle like Ecom Tools earns its place in the analytics stack, because the tools that measure these metrics are expensive bought separately. Inside the bundle:
- KaloData is TikTok Shop analytics: it surfaces top shops, rising products, and sales estimates, which gives you a read on competitor AOV and revenue on the fastest-moving channel. That is a benchmark for your own AOV and demand, not your P&L. The vendor states openly that its figures are scraped estimates, so treat them as directional.
- ShopHunter tracks Shopify store revenue by watching inventory movement, so you can see roughly what a competitor is selling before you commit to a product. That informs the LTV and validation side, whether a market is real.
- PipiAds is ad intelligence: it shows the creatives and angles already converting, which is the lever on CAC and ROAS, because a proven angle lowers your cost to acquire.
The honest framing: these tools measure the market and your competitors, giving you the numbers to set targets. They do not measure your contribution margin. That stays your job, and it is the job that matters most. If you want to see the full catalogue and what each tool does, read what is included in Ecom Tools, and if you are running the savings math, the real SaaS savings calculator guide shows how to compute it against retail. For the metrics that come earlier in the funnel, the product research glossary for beginners covers the demand side, and the product validation checklist turns these numbers into a go or no-go call.
Where to be careful
Three honest cautions, because a metrics glossary that pretends the numbers are clean is lying to you.
- Benchmarks are directional, not law. Every range above comes from a named source, but sources disagree because they measure different samples with different methods. A conversion rate of 1.4% and 2.66% can both be true depending on whose stores and which denominator. Use these as a compass, not a verdict, and always weigh your own trend over any global average.
- The tools are shared access, not your own accounts. Ecom Tools is a group-buy: the analytics tools come as shared credentials delivered through Discord, not subscriptions in your name. Access to any single tool can change if a vendor's terms shift, and group-buy licensing sits in a grey zone with the original vendors. The group-buy licensing and account-risk guide covers what can go wrong. Weigh that before you build a reporting process around one specific tool.
- No tool computes your survival number for you, and outcomes vary. Contribution margin depends on your real costs, which only you have. The operator behind Ecom Tools is semi-anonymous, known in Whop reviews only as Rony, and the tool list can change, so verify the current catalogue and any plan or refund terms at checkout rather than trusting a list months old, including this one.
FAQ
What is the single most important ecommerce metric?
Contribution margin after marketing. It is what a sale leaves behind once you subtract every variable cost including the ad that won the customer. Revenue tells you money moved; contribution margin tells you money stayed. A store can grow revenue every month and still go bankrupt if this number is negative, which is exactly why it, not revenue, is the survival metric.
How do I calculate breakeven ROAS?
Breakeven ROAS equals 1 divided by your profit margin in decimal form. At a 25% margin that is 1 divided by 0.25, which is 4.0, so you need a 4:1 ROAS just to break even. At a 50% margin it is 2.0. Any ROAS below your breakeven number loses money no matter how large it looks, because ROAS measures revenue, not profit.
What is a good LTV to CAC ratio?
3:1 is the widely cited healthy benchmark, backed by David Skok's research across hundreds of companies. Below 3:1 there is rarely enough margin to cover overhead and still grow; 2:1 is a thin cushion; 4:1 to 5:1 is where the most profitable brands sit. Always use gross margin, not revenue, in your LTV, or the ratio flatters bad economics. The right target still depends on your vertical and margins.
What chargeback rate is dangerous in 2026?
The all-industry average sits near 0.65%, and staying under 0.5% is the safe buffer. This matters more in 2026 because Visa's excessive-merchant threshold, reported at 2.2%, is set to tighten to 1.5% on April 1, 2026, and processors flag merchants internally well before that. Cross a network line and you risk losing the ability to take payments. Confirm current thresholds with your own processor, since network rules change.
Do the tools in Ecom Tools calculate these metrics for me?
Partly. KaloData, ShopHunter, and PipiAds give you competitor AOV, revenue estimates, and proven ad angles, which are the market inputs and benchmarks for your targets. They do not compute your contribution margin, because that needs your own cost of goods, fees, and shipping, which only you have. Treat the bundle as the source of market data, not as your profit-and-loss statement.
The decision filter
If you can recite your revenue but not your contribution margin after marketing, you do not know whether your business works, and no amount of top-line growth will tell you. Learn the seven metrics above, compute the last one from your own books first, then use market tools to set the targets for the other six. If you want the competitor analytics without paying full retail for each platform, start on the Pro plan and test the fit: Ecom Tools Pro, $29.99/month, or commit once with the Lifetime plan at $499 one-time. Whether you buy the tools or not, the rule stands: measure what stays, not what moved. For the full worth-it argument, read the Ecom Tools worth-it review.